Injury Costs Across the Lifespan

The causes, outcomes, and costs of injury change across the lifespan.

Injury Costs Across the Lifespan

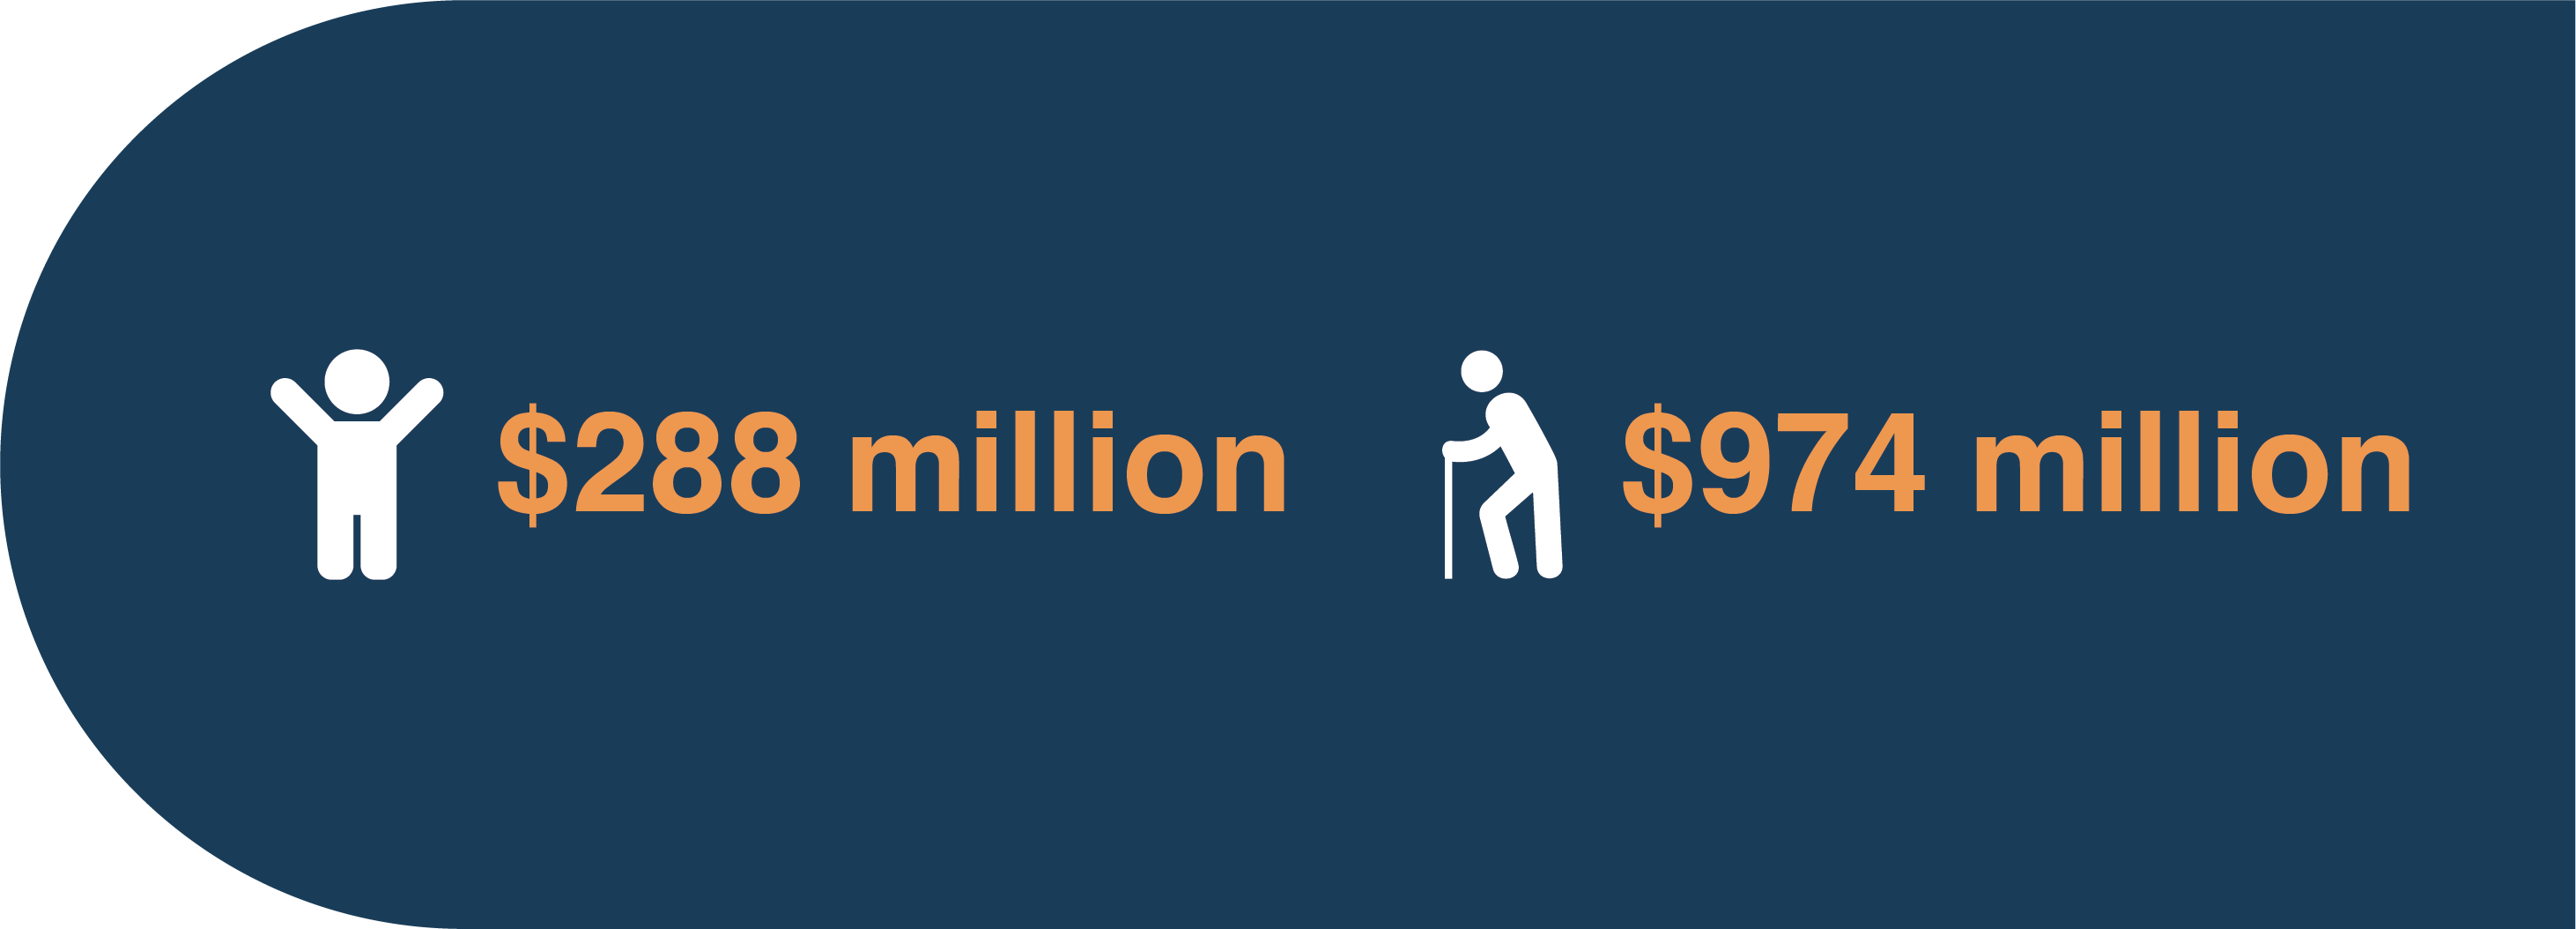
The total cost of injury by age group in 2018 were:

  • $288 million among children aged 0-14 years
  • $618 million among youth & young adults aged 15-24 years
  • $2.2 billion among adults aged 25-64 years
  • $974 million among older adults aged 65 years and older

The total cost of injury by leading cause for each age group were:

  • $113 million for falls among children aged 0-14 years
  • $130 million for transport incidents among youth & young adults aged 15-24 years
  • $595 million for unintentional poisoning among adults aged 25-64 years
  • $769 million for falls among older adults aged 65 years and older

Injury outcome

For children aged 0-14 years, the total cost of injury by outcome in 2018 were:

  • $29 million for injury deaths
  •  $20 million for injury hospitalizations
  •  $120 million for injury ED visits
  •  $120 million for injury disability

For youth & young adults aged 15-24 years, the total cost of injury by outcome were:

  •  $279 million for injury deaths
  •  $48 million for injury hospitalizations
  •  $177 million for injury ED visits
  •  $114 million for injury disability

For adults aged 25-64 years, the total cost of injury by outcome were:

  •  $971 million for injury deaths
  •  $268 million for injury hospitalizations
  •  $670 million for injury ED visits
  •  $248 million for injury disability

For older adults aged 65 years and older, the total cost of injury by outcome were:

  •  $36 million for injury deaths
  •  $504 million for injury hospitalizations
  •  $267 million for injury ED visits
  •  $167 million for injury disability

The table below depicts total costs in millions for cause and outcome of injury, by age group and sex, across BC and the Health Authorities.

Using Tableau

Many of the data figures below include filters you can use to customize the display. Use the filter drop-down menus at the top of the figure to select an age group, sex, cause, cost type, or measure (e.g., cases or rates). When a filter is selected, the title and contents of the data figure will change automatically.

Please note that case counts fewer than 5 are not identified in the tables or charts. Figures are best viewed in full screen.

The Tableau tool bar at the bottom of each chart provides additional functionality:

Share icon

Use the Share icon to copy a link to the figure, or to share it via email, Twitter, or Facebook.

Download icon

Use the Download icon to download the figure as an image or PDF, or to download the data used

Fullscreen icon

Use the Full-screen icon to enlarge the figure to fit the screen

For children aged 0-14 years, the cost per outcome of all injuries in 2018 were:

  • $1,319,606 for injury deaths
  • $10,93310,728 for injury hospitalizations
  • $1,225 for injury ED visits
  • $273,752 for injury disability

For youth & young adults aged 15-24 years, the cost per outcome of all injuries in 2018 were:

  • $1,240,794 for injury deaths
  • $17,276 for injury hospitalizations
  • $1,630 for injury ED visits
  • $153,746 for injury disability

For adults aged 25-64 years, the cost per outcome of all injuries in 2018 were:

  • $599,246 for injury deaths
  • $22,265 for injury hospitalizations
  • $2,138 for injury ED visits
  • $86,972 for injury disability

For older adults aged 65 years and older, the cost per outcome of all injuries in 2018 were:

  • $44,854 for injury deaths
  • $30,316 for injury hospitalizations
  • $2,819 for injury ED visits
  • $35,364 for injury disability

The table below depicts cost per outcome for cause and outcome of injury, by age group and sex, across BC and the Health Authorities.

Cost type: direct and indirect

The direct costs of injury by age group in 2018 were:

  • $199 million among children aged 0-14 years
  • $279 million among youth & young adults aged 15-24 years
  • $1,105 million among adults aged 25-64 years
  • $974 million among older adults aged 65 years and older

The indirect costs of injury by age group were:

  • $89 million among children aged 0-14 years
  • $339 million among youth & young adults aged 15-24 years
  • $1,053 million among adults aged 25-64 years
  • $0 indirect costs for older adults aged 65 years and older, as there is no productivity loss for this age group.

The table below depicts costs in millions for cause of injury and type of costs, by age group and sex, across BC and the Health Authorities.

Leading causes of injury

The total costs of injury by leading cause and age group in 2018 were:

  • $113 million for falls among children aged 0-14 years
  • $130 million for transport incidents& $129 million for unintentional poisoning among youth & young adults aged 15-24 years
  • $595 million for unintentional poisoning & $393 million for falls among adults aged 25-64 years
  • $769 million for falls among older adults aged 65 years and older

The direct costs of injury by leading cause and age group were:

  • $78 million for falls among children aged 0-14 years
  • $62 million for transport incidents & $50 million for falls among youth & young adults aged 15-24 years
  • $321 million for falls & $190 million for transport incidents among adults aged 25-64 years
  • $768 million for falls among older adults aged 65 years and older

The indirect costs of injury by leading cause and age group were:

  • $35 million for falls among children aged 0-14 years
  • $120 million for unintentional poisoning & $83 million for suicide/self-harm among youth & young adults aged 15-24 years
  • $547 million for unintentional poisoning & $216 million for suicide/self-harm among adults aged 25-64 years
  • $0 indirect costs for older adults aged 65 years and older, as there is no productivity loss for this age group.

The figure below depicts costs in millions for leading causes of injury and type of costs, by age group and sex, across BC and the Health Authorities.