


The Human Cost of Injury
The Human Costs of Injury
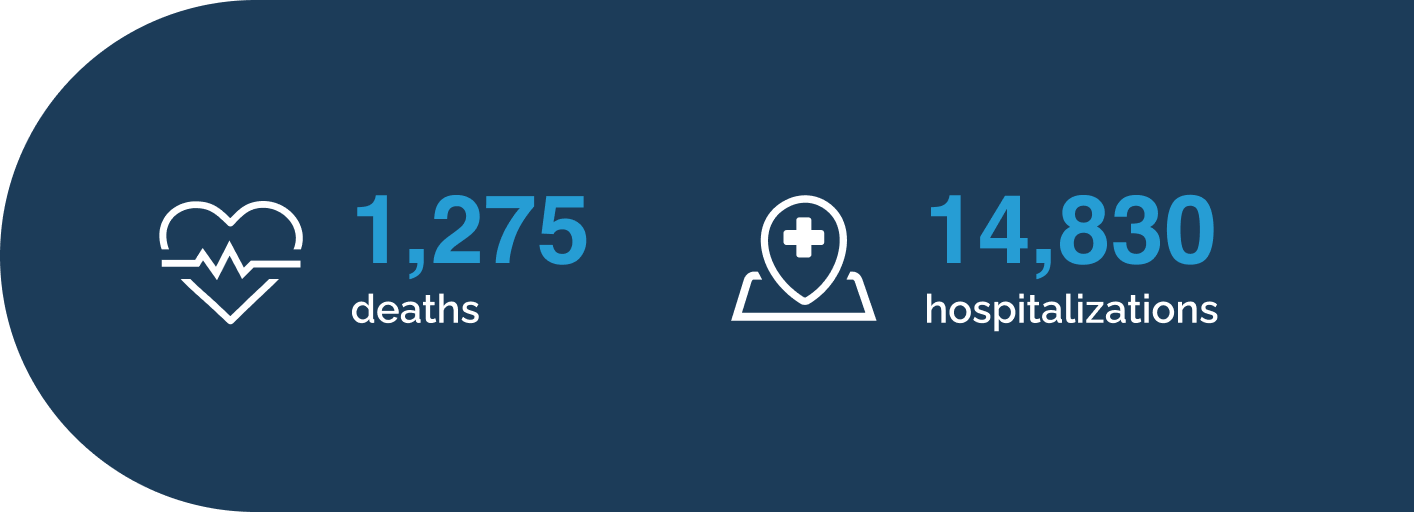
In 2018, injuries resulted in more than:
- 1,275 deaths
- 3,949 disabilities
- 14,830 hospitalizations
- 273,567 emergency department (ED) visits
Each of these cases represents a person whose life was impacted or taken by injury. The human costs of injury are both physical and emotional, and are felt by individuals, families, communities, and society as a whole.
Intent of injury
Unintentional injuries account for the majority of injury cases:
- 74 per cent of deaths
- 87 per cent of hospitalizations
- 95 per cent of ED visits
- 89 per cent of disabilities
Those aged 85 and older have the highest rate across all injury outcomes.
Using Tableau
Many of the data figures below include filters you can use to customize what is displayed. Use the filter drop-down menus at the top of the figure to select an age group, sex, cause, cost type or measure (e.g., cases or rates). When a filter is selected, the title and contents of the data figure will change automatically.
Please note that case counts fewer than 5 are not identified in the tables or charts.
The Tableau tool bar at the bottom of each chart provides additional functionality :

Use the Share icon to copy a link to the figure, or to share it via email, Twitter, or Facebook.

Use the Download icon to download the figure as an image or PDF, or to download the data used

Use the Full-screen icon to enlarge the figure to fit the screen
Cause of injury
For all ages combined, falls was the leading cause of injury deaths, followed by suicide/self-harm, and transport incidents. Falls were the leading cause of hospitalizations, followed by transport incidents, suicide/self-harm, and unintentional poisoning.
The leading causes of injury vary when examined by age group. For example, for youth and young adults between ages 15 and 24, suicide/self-harm and transport incidents were top causes of death and hospitalization.
Potential years of life lost
Potential Years of Life Lost (PYLL) emphasizes the loss of potential contribution younger individuals can make to society, and draws more attention to the causes of death that affect younger populations.
The total of 23,326 Potential Years of Life Lost (PYLL) due to injury emphasize the immense loss of life and potential when injuries kill people at a young age. Despite the 75+ age group having the highest death rate, PYLL places no value to these deaths. For all injuries, PYLL rate is highest in the 20-24 year old age group. The number and rate of deaths tend to be higher among older people because the risk of death increases with age. This can bias society to focus only on those causes of death that predominantly affect older populations. For unintentional injuries, the highest death rate was among those aged 75 and older. The exception was unintentional poisoning, where the death rate peaked in the 20-to-24 age group. For inflicted injuries, the death rate was highest among 20- to 24-year-olds.
PYLL can be used to quantify the human impact of all injury deaths. PYLL is calculated as the reference age minus the age at death. For the visualization below, the PYLL is based on a conservative life expectancy of age 75.
Learn More
Disability adjusted life years
The Disability Adjusted Life Years (DALY) are the sum of years of life lost (YLL) due to premature death and years of healthy life lost due to disability (YLD). Unlike the calculation for Potential Years Life Lost (PYLL), where the same average life expectancy is applied to each case (e.g., 75 years of age), the YLL assumes that everyone who has died has also lost years of life, even if they have exceeded the average life expectancy.
DALY quantifies the human impact of deaths and disability. The DALY puts more emphasis on both the deaths and the disability occurring among younger age groups, as those who are younger have more years of healthy life to lose. This is particularly important to note when comparing causes that affect different age ranges. DALYs should not be used to compare causes of injury that are age-specific; for example, falls among older adults with self-harm among youth. In injury prevention, DALYs are used to determine effectiveness of programs and interventions, as well as resource allocation.
The DALYs are driven by unintentional injuries as they account for the majority of injury cases. In Atlantic Canada, in 2018, unintentional injuries accounted for 74% of injury deaths, 87% of injury hospitalizations, and 95% of ED visits.
Learn More
Copyright 2022 - All Rights Reserved