


Injury Costs Across the Lifespan
Injury Costs Across the Lifespan
Every stage of life presents the potential to live life to the fullest. The causes, outcomes and costs of injury shift over the course of a person’s lifetime.
Injury outcome
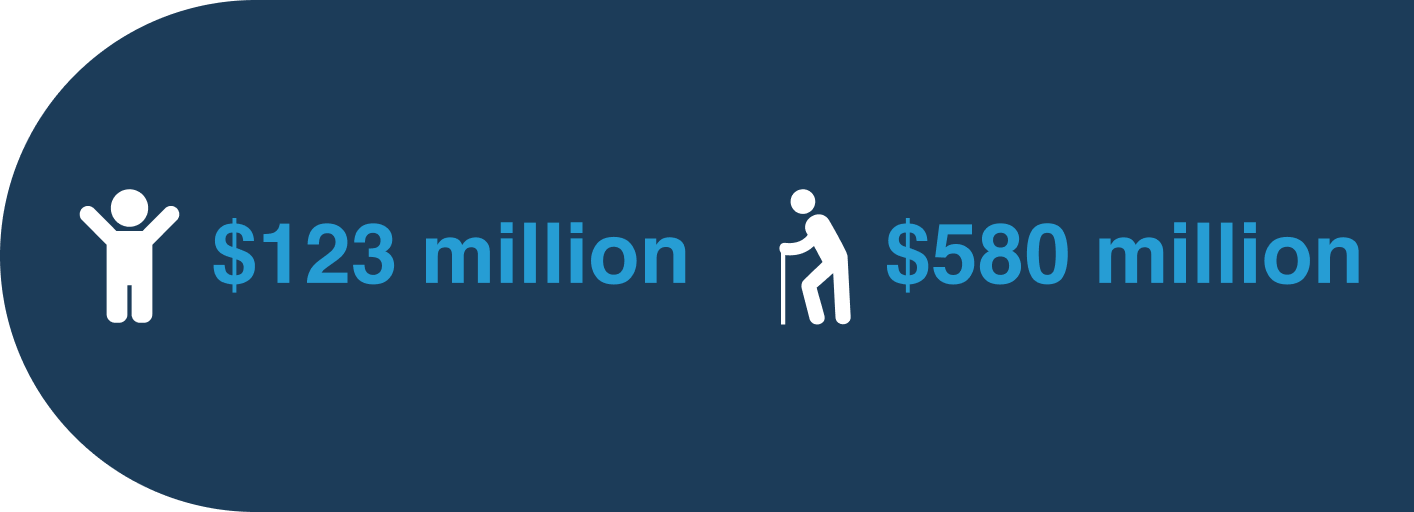
The total cost of injuries to children (up to 14 years) was $123 million in 2018. Total cost was $283 million for youth and young adults (ages 15 to 24), $801 million for adults (ages 25 to 64) and $580 million for older adults.
Using Tableau
Many of the data figures below include filters you can use to customize what is displayed. Use the filter drop-down menus at the top of the figure to select an age group, sex, cause, cost type or measure (e.g., cases or rates). When a filter is selected, the title and contents of the data figure will change automatically.
Please note that case counts fewer than 5 are not identified in the tables or charts.
The Tableau tool bar at the bottom of each chart provides additional functionality :

Use the Share icon to copy a link to the figure, or to share it via email, Twitter, or Facebook.

Use the Download icon to download the figure as an image or PDF, or to download the data used

Use the Full-screen icon to enlarge the figure to fit the screen
Cost type
Costs for falls totalled $52 million for injuries in children and $463 million for injuries in older adults. For falls among older adults, the highest total cost was for injuries to females aged 85-plus ($308 million).
Transport incidents was the top contributor to total injury costs for youth and young adults, at $77 million. Suicide/self-harm were second with a total cost of $70 million for this age category.
Leading causes of injury
Falls were the biggest contributor to total and direct costs for injury in children, adults and older adults. Among youth and young adults, transport incidents had the highest total and direct costs. Among youth and young adults, and adults, suicide/self-harm were the biggest contributor to indirect costs.
The causes associated with highest direct costs were falls for children, adults, and older adults, and transport incidents for youth and young adults.
Indirect costs for injuries among older adults are presented as zero due to the methodology used, which assumes a retirement age of 65. While this may be an accepted standard methodology for this type of study, it is not reflective of the participation of older adults in the workforce in Atlantic Canada, which continues to grow. This will be revisited in future reports.
Copyright 2022 - All Rights Reserved