


BC Priorities: Falls, Transport Incidents, and Suicide/Self-harm
BC Priorities: Falls, Transport Incidents, and Suicide/Self-harm
The BC Injury Prevention Committee (BCIPC), the BC Injury Prevention Alliance (BCIPA), and the BC Falls and Injury Prevention Community of Practice (CoP) function to advance public policy on injury prevention.
The three provincial priorities are:
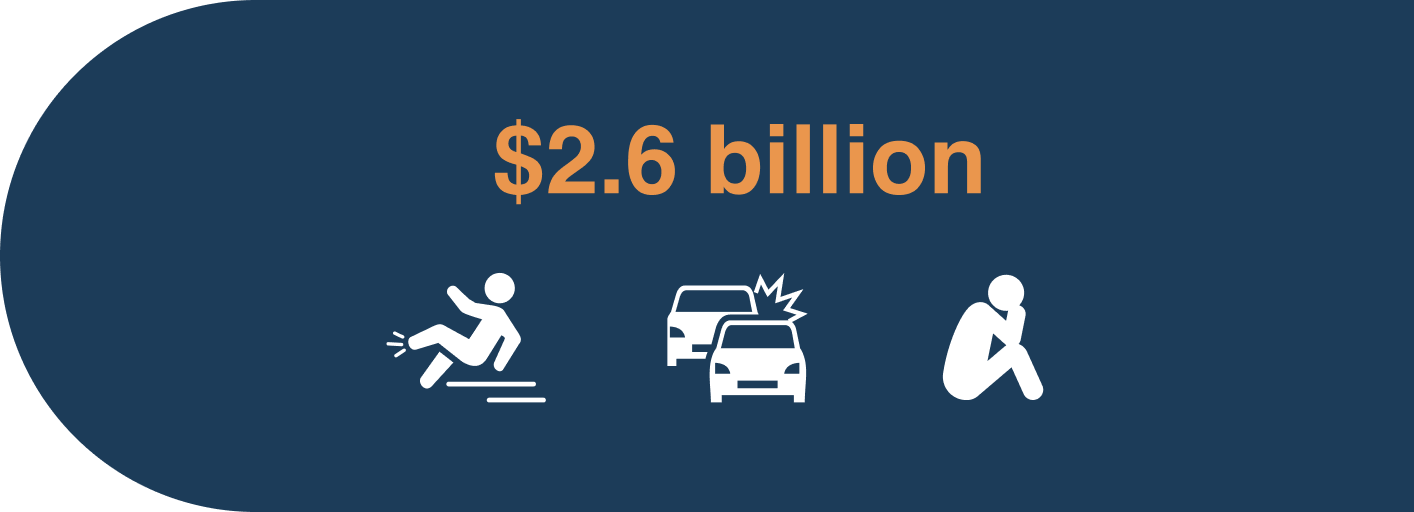
- Community-dwelling seniors falls and fall-related injury prevention
- Transport-related injury prevention
- Youth suicide and self-harm prevention
Almost all these injuries and their resulting costs, could have been prevented. We must take action to create a different story; a story of a province free from serious injury.
The tables and figure below explore falls, transport incidents, and suicide/self-harm by presenting data for specific types of incidents within these three causes.
Using Tableau
Many of the data figures below include filters you can use to customize the display. Use the filter drop-down menus at the top of the figure to select an age group, sex, cause, cost type, or measure (e.g., cases or rates). When a filter is selected, the title and contents of the data figure will change automatically.
Please note that case counts fewer than 5 are not identified in the tables or charts. Figures are best viewed in full screen.
The Tableau tool bar at the bottom of each chart provides additional functionality:

Use the Share icon to copy a link to the figure, or to share it via email, Twitter, or Facebook.

Use the Download icon to download the figure as an image or PDF, or to download the data used

Use the Full-screen icon to enlarge the figure to fit the screen
Total costs by cost type
Per capita costs by cost type
Total costs by injury outcome
Costs per case by outcome
Cases and rates
Copyright 2022 - All Rights Reserved